
Firing of three relief valves on a steam line operating at 225 °C and 9.5 barg was analysed in CAESAR II, with dynamic loads generated in BOSfluids. The spectrum analysis gave a combined dynamic and static stress of 128% of the occasional allowable stress and the time-history analysis including the steel structure gave 122%, with the fatigue assessment showing the expected fatigue life to be sufficient.
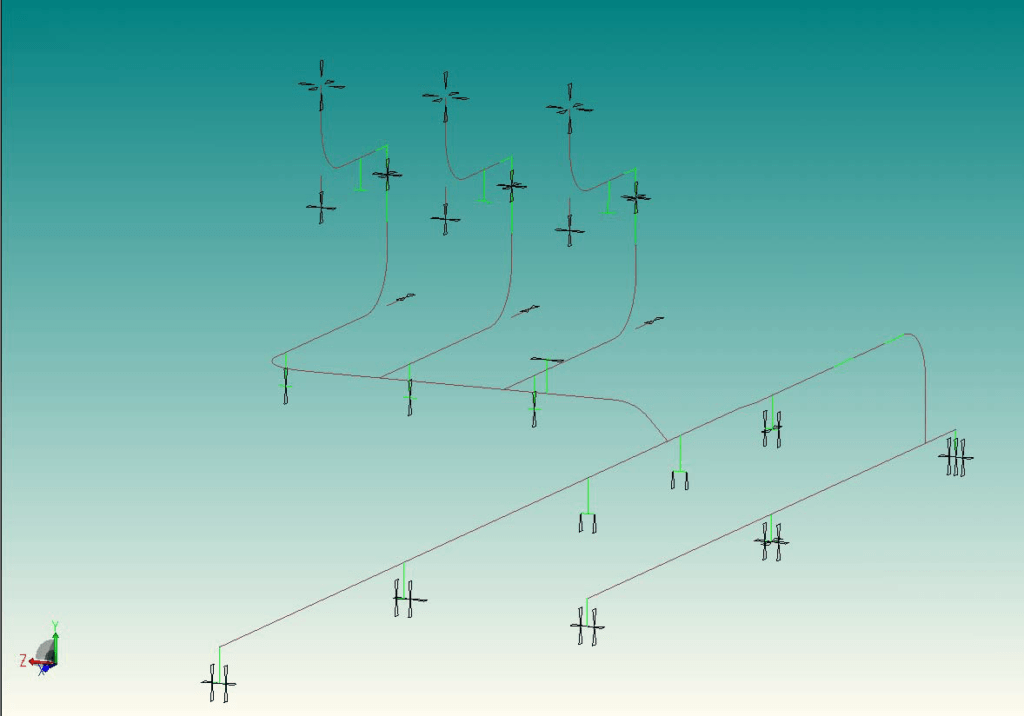
When the relief valves on a steam line open, a large amount of steam is suddenly relieved. The thrust loads on the piping come from the momentum flux of the escaping steam and from expansion waves that travel upstream through the system. The low pressure steam line in this combined heat and power project operates at 225 °C and 9.5 barg and splits into three branches, each running to a relief valve. The dynamic stress analysis covered the firing of all three relief valves. Its purpose was to investigate whether the existing design ensures safe and reliable operation, and to recommend improvements if it was not acceptable.
Relief Valve Firing Loads on LP Steam Piping
The waves that move upstream through the piping generate temporary pressure differences between consecutive bends and intersections. These differences produce time-dependent unbalanced loads in the sections between those bends and intersections, and the loads cause transient movements and vibrations of the system. The speed of sound, the pressure rate of change and the pipe or bend length determine the time history of each load, which is the time over which it builds up and acts in a given part of the system.
Typical values with one relief valve open are a thrust load of 149.9 kN and a speed of sound of 547 m/s for pipe of 457 mm outer diameter. The spectrum analysis of the piping without the steel structure, with the as-designed supports, showed that the dynamic loads caused large overstressing and large displacements. A later time-history analysis of the same model gave the same conclusion.
CAESAR II and BOSfluids Model for Relief Valve Firing
The pipe stress model was built in CAESAR II from the isometric drawings provided by the client. The isometrics showed one branch, so two branches were added similar to the existing one. Weight, temperature, pressure and the original as-designed supports were included. The model used design temperatures of 225 °C and -20 °C, an installation temperature of 21 °C and a design pressure of 9.5 barg. Downstream of the relief valves, the values used were 30 °C and 2.1 barg, based on BOSfluids calculations and a conservative estimate of the backpressure.
Pipe properties are for St 37.0 (Re 235 N/mm² at 20 °C and 123.8 N/mm² at 225 °C; Rm 350 to 480 N/mm²) and the steel structure properties are for FE360. CAESAR II determined the allowable stress for each load case from these properties and the applicable code, Stoomwezen RToD.
The initial pipe stress model was used to generate a BOSfluids model, which established the dynamic loads in the piping between the main header and the relief valve exhaust piping. Load rise and fall-off times were calculated and used to determine the time-history diagram of the load, and the time-dependent loads were applied in the CAESAR II model.
Two situations were investigated. The piping model with shoes and without the steel structure was analysed statically and by spectrum analysis, with the supporting to be modified if required. The piping model including the steel structure was analysed statically and by time-history analysis, with the steel structure to be modified if required. A spectrum analysis determines the natural frequencies and mode shapes of the piping and the participation factor of each mode shape, and combines the stresses and displacements of all mode shapes into a final system response. When the load time histories are not exactly known, it gives reliable but conservative results.
Axial Fixations, Spectrum Result and Time-History Model
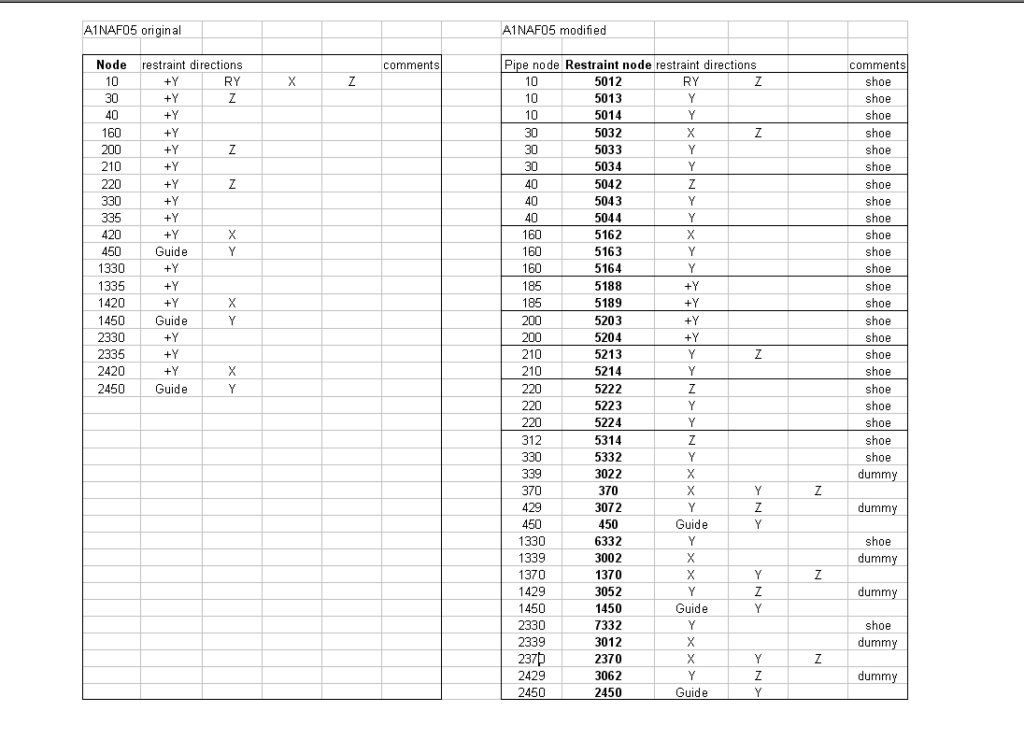
The main remedy was to introduce additional axial fixations in the straight pipe sections. The revised arrangement also had to allow sufficient thermal expansion to keep static stresses within allowable limits, and some support locations were changed to obtain a better load distribution. The axial supports in the branches were modelled as dummies, which appeared to be the best approach in the spectrum analysis. A different solution may be considered in the time-history approach and in practice.
The stop in the existing header had to be moved 6000 mm east, from node 10 to node 160, to accommodate the static loads in the partial model and keep static stresses within allowable figures. The effect on the complete existing system was not examined. The spectrum analysis gave a combined dynamic and static stress of 128% of the occasional allowable stress of Stoomwezen RToD at node 316, which exceeds the allowable.
The stress analyses of the high-pressure system had shown that the spectrum approach was too conservative to achieve acceptable results, so a time-history approach, which gives more realistic results, was chosen. In a time-history analysis the loads are applied as a function of time and the response is calculated per time step. The relief valves were assumed to open quickly and completely when the system pressure exceeds the set pressure, but not at exactly the same time. The opening time of a valve was taken as 30 ms and the time between valve firings as 250 ms.
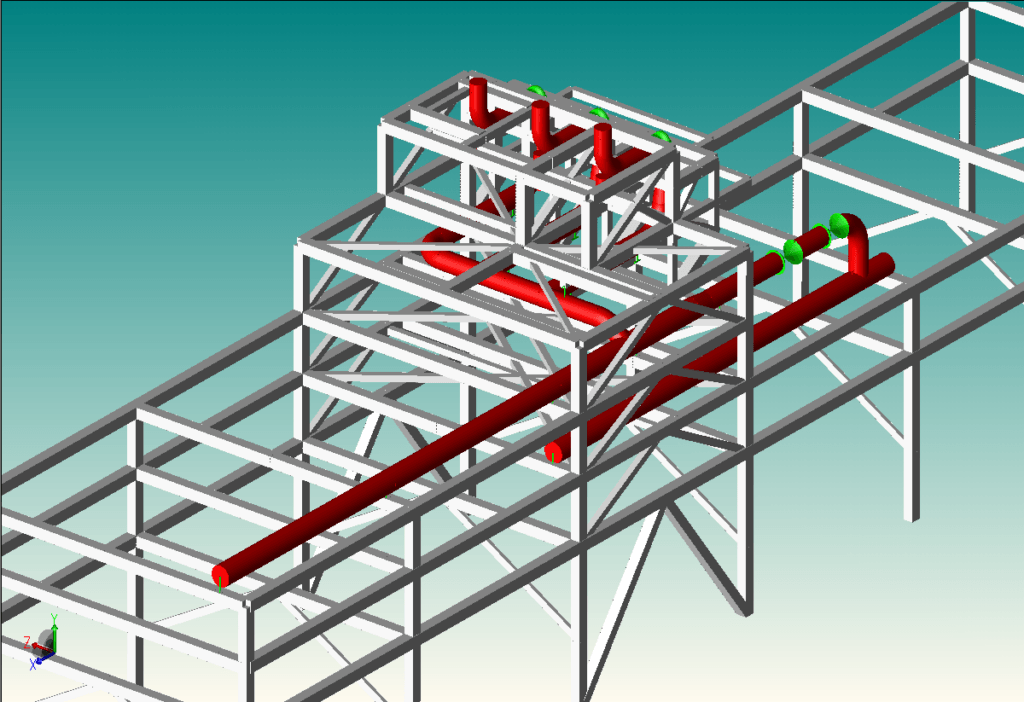
The available steel structure information was intended for one relief valve. The steel structure model was made suitable for three valves and for the modified supporting, and the adaptations were made for modelling purposes. In practice, different solutions may be applied. The steel structure was included for accuracy purposes; without it, the supports are fixed to the world. The model including the steel structure was analysed for operating and dynamic conditions at 225 °C.
Relief Piping Stress Results and Fatigue Assessment
The time-history analysis of the model including the steel structure gave a maximum dynamic stress of 64 N/mm². The combined static and dynamic stress was 120 N/mm² at node 314, which is 122% of the occasional allowable stress of Stoomwezen RToD and exceeds the allowable. The time-history values are below those of the spectrum analysis, which gave 102 N/mm² dynamic stress and 128% combined stress at node 316.
At the points where the dynamic stress exceeds the limit for infinite life, a fatigue assessment of the dynamic stresses only was carried out as an alternative, equally valid assessment approach. The stress amplitude determines the fatigue life, so only the dynamic stresses from the spectrum analysis were used. The maximum dynamic stress, 102 N/mm² at node 316, occurs in the branch from the tee at node 316 to node 2330, towards the central relief valve. On the ASME VIII Div. 2 design fatigue curve, the allowable number of cycles for this stress amplitude is of the order of 500,000. With ten full stress cycles per valve opening taken as a conservative estimate, the valve could be fired 50,000 times during its fatigue life, which corresponds to 7 events per day for 20 years. The design fatigue curve contains at least a safety factor of 2 on stress or 15 on cycles, whichever is the smaller. From a fatigue point of view, the expected fatigue life is sufficient.
The piping model with shoes and without the steel structure was assessed statically in the load cases OPE, SUS and EXP for the hot design case at 225 °C and for a line temperature of -20 °C. The static stresses are within the allowables. Utilisations are 42% for sustained stress at node 20 and 67% for expansion stress at node 190 in the hot case, and 22% for sustained stress at node 20 and 13% for expansion stress at node 314 at -20 °C. To check the static stress range between the hot and cold cases, which determines the thermal fatigue life, the maximum expansion utilisations of both cases were added: 67 + 13 = 80%. This is below 100% and is conservative because the maximum utilisations occur at different positions.
Support, Method and Fatigue Findings for Relief Piping
The as-designed supporting was not sufficient to accommodate the large dynamic loads and to limit the system response caused by opening the relief valves. The support arrangement was changed and new supports were introduced, mainly to accommodate the dynamic (axial) loads in the piping, and the piping routing was not changed. The spectrum analysis gave a combined dynamic and static stress of 128% of the occasional allowable stress and the time-history analysis gave 122%. At the points where the dynamic stress exceeds the limit for infinite life, the fatigue assessment shows the expected fatigue life to be sufficient.
Frequently Asked Questions
What loads act on steam piping when a relief valve fires?
Thrust loads act on the system. They come from the momentum flux of the escaping steam and from expansion waves that travel upstream. The waves create temporary pressure differences between consecutive bends and intersections, and these differences produce time-dependent unbalanced loads in the sections between them. For pipe of 457 mm outer diameter with one valve open, typical values are a thrust load of 149.9 kN and a speed of sound of 547 m/s.
Why use a time-history analysis instead of a spectrum analysis for relief valve firing?
A spectrum analysis gives reliable but conservative results when the load time histories are not exactly known. In the stress analyses of the related high-pressure system it was too conservative to achieve acceptable results, so a time-history analysis was chosen here. The time-history analysis applies the loads as a function of time, calculates the response per time step and gives more realistic results. The combined stress was 128% of the occasional allowable stress in the spectrum analysis and 122% in the time-history analysis.
How is fatigue assessed for the dynamic stresses from relief valve firing?
The assessment uses the dynamic stresses only, because the stress amplitude determines the fatigue life. The maximum dynamic stress of 102 N/mm² allows of the order of 500,000 cycles on the ASME VIII Div. 2 design fatigue curve. With ten full stress cycles per valve opening, the valve could be fired 50,000 times, equal to 7 events per day for 20 years. The curve contains at least a safety factor of 2 on stress or 15 on cycles, whichever is the smaller.