
A Branch Failure on a Methanol Plant Steam Header
A methanol plant operating on a 3,000 tonnes per day basis suffered a piping failure on 19 May 2012. A ¾ inch branch broke off the medium-pressure (MP) steam header when the turbine driving the synthesis gas compressor tripped. In normal operation the turbine discharges MP steam at 28 barg and 340°C into the header. On a trip its steam inlet closes immediately, and the high-pressure (HP) steam that would have entered it, at 105 barg and 520°C, is let down to the MP header at 450 tonnes/hr through a throttling valve, with quench water added at 50 tonnes/hr. The failure showed that the piping cannot accommodate this transient adequately.
Inspection Findings and Static Analysis
A site inspection recorded that the ¾ inch line had detached completely from its sock-o-let with a cup-cone type fracture, that the header had moved about 180 mm laterally to the east, that the support at node 2090 was twisted, and that the guide intended at node 2030 in the design documentation was missing. A static analysis without that guide gave a lateral displacement of only 13 mm for the maximum temperature operating case, so elevated pressure and temperature, both quasi-static, could not explain the movement. Two transient mechanisms that can generate large unbalanced loads during a trip were investigated: surge and slug loads.
Slug Load Dynamic Analysis and Support Modifications
The support modifications come from a time history analysis of a single condensate slug, the scenario considered the most plausible failure scenario, although the steam trap malfunction behind it could not be confirmed in the field. The proposals are additional guides at existing supports and additional axial restraints in the trip line.
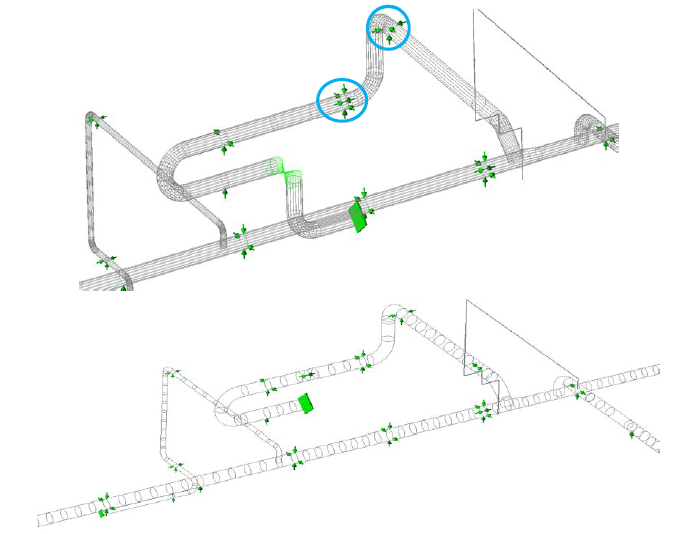
The slug impact force is F = ρAV², where ρ is the slug density, A the inner cross-sectional area of the pipe and V the slug velocity. The slug accelerates to a final velocity of 36 m/s during valve opening, at which the maximum impact force is 457 kN. The first bends of the trip line see a lower force than the last bends and the tee. The response was determined by a time history analysis in CAESAR II following ASME B31.3, with the difference in impact time at each bend included.
The original support arrangement, with no guide at node 2030, gave about 220 mm of simulated travel against about 180 mm measured. The slug forces in the remaining analyses were therefore reduced by a factor of 1.2, which gives about 190 mm. Before this reduction, the stresses under the single slug load, as percentages of the ASME B31.3 occasional load allowable (100% being the allowable), were 599% on the trip line, 1477% at the ¾ inch line tee, 588% on the line south of the trip line and 620% on the 24 inch line of route A. Most of the overstressed locations were at or near branches.
Including the previously missing guide did not improve the stresses sufficiently on its own, so additional guides were proposed at existing supports only, which minimises the need for additional support structures. With these guides and the 1.2 reduction, the stresses were 157% on the trip line, 109% at the ¾ inch line tee, 62% on the line south of the trip line and 54% on the 24 inch line of route A. Overstressed locations remained in the trip line, especially in the elbows, so additional axial restraints were proposed.
ASME B31.3 Stress and Fatigue Results at the Header Tee
With the guides and axial restraints, and the same 1.2 reduction, the stresses were 48% at the ¾ inch line tee, 47% on the line south of the trip line and 43% on the 24 inch line of route A. At node 2040, a tee on the header, the original system gave 600% and the modified system gave 119%, the only value above 100%. The 119% uses the allowable at the 390°C design temperature. The allowable at the 340°C pipe wall temperature in operation is 11% higher, which gives a stress of 107%. A stress of 107% does not comply with ASME B31.3. The improvement relative to the original system was achieved by modifying the supports only. A support modification proposal based on this analysis is equally valid if the dynamic load is a transient load other than a single slug.
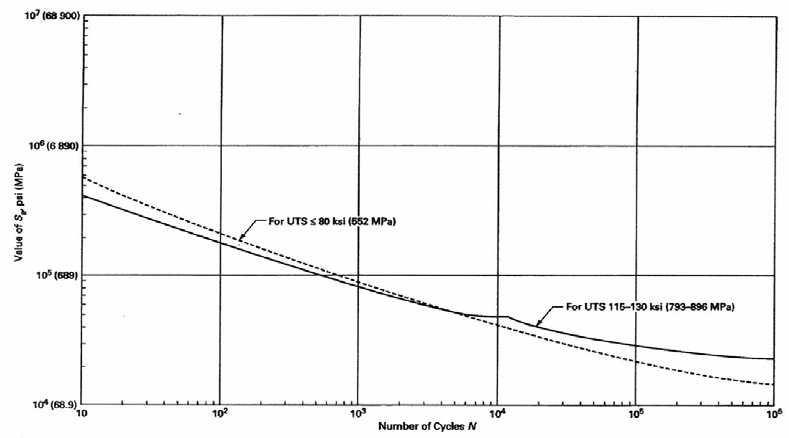
The slug load, which acts for a short duration, was also assessed as a fatigue load against the ASME B&PV Section VIII, Division 2 design fatigue curve. For a fatigue evaluation, stresses calculated in CAESAR II are multiplied by 2 when the highest stress occurs in a fitting, to account for stress peaks. At node 2040, a tee containing a weld, the stress with all modifications is 150 MPa (107% of the allowable), which gives a stress amplitude of 300 MPa after multiplication. The curve allows about 10,000 cycles at that amplitude. Taking 4 full stress cycles per slug impact as a conservative value, the allowable number of slug impacts with all modifications is about 2,500. Without the axial restraints, the stress at node 2040 is 200 MPa, which gives a stress amplitude of 400 MPa after multiplication. The allowable number of slug impacts with the additional guides installed is about 1,000.
Support Quality on 24 Inch to 28 Inch Piping
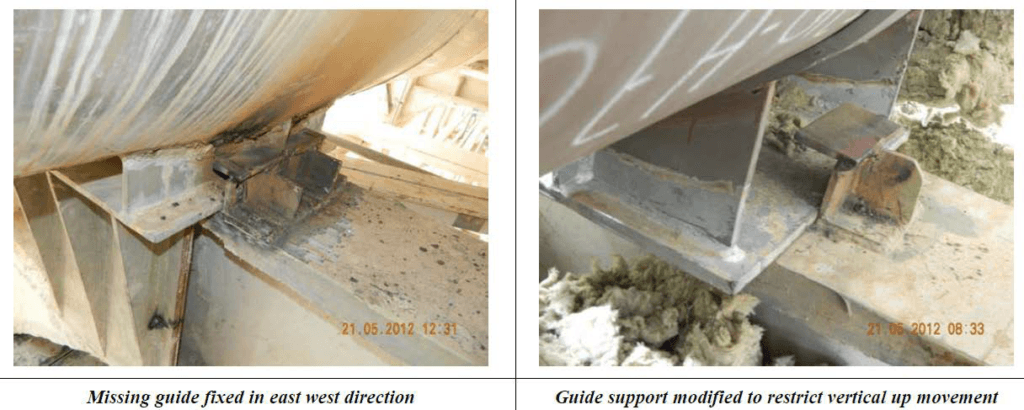
Photographs and drawings of supports received for the analysis give an overall impression that certain supports for 24 inch to 28 inch piping are of low quality. One photograph shows a poor quality weld on both the pipe and the support bracket. Improper welding on the pipe may lead to fatigue stress problems, and improper welding of the bracket may lead to unintended support functions, which make the stress analysis unreliable. Another shows a vertical restraint with a gap too large to restrain the pipe properly in the vertical direction. If the pipe lifts off, the bracket is loaded unfavourably, which reduces the maximum sideways load it can take. Improving these supports may be considered so that fatigue does not become an issue in operation.
Slug Formation and Condensation Scenarios
The scenarios below were examined before the single condensate slug was adopted as the load case. A slug is a liquid volume that fills the complete cross-section of the pipe and moves with the gas. At an elbow or tee, its directional change of momentum produces a large unbalanced load. Three scenarios were examined. In the first, MP steam (28 barg, 340°C) at 450 tonnes/hr mixes with 50 tonnes/hr of quench water with no energy transfer, giving the maximum water-to-steam ratio. With all the water assumed not to evaporate and to flow in one direction, either positive Z (155 tonnes/hr of steam, route B) or negative Z (245 tonnes/hr of steam), three flow regime maps (Baker; Hewitt and Roberts; Taitel and Dukler) predicted annular or wavy flow. Both are steady and do not generate large piping loads.
In the second, HP steam (105 barg, 520°C) at 450 tonnes/hr mixes with the quench water with energy transfer. The energy balance showed that all the water evaporates, so no slug can form. This assumes that energy transfer is complete before the mixture reaches the header, which seems justifiable given at least 20 m of pipeline between the mixing point and the header. In the third, condensation of the let-down steam on the trip line wall, which is at 227°C when idle, was checked. About 314 m of pipe would be needed to cool the let-down steam (28 barg, 349°C) to its boiling point, against a trip line length of about 34 m. The steam is still superheated at the end of the trip line, so no significant condensation occurs, and none of the three scenarios produced slug formation.
BOSfluids Surge Analysis and the Condensate Slug Mechanism
Surge was modelled in BOSfluids. Exact valve closing times were not available, so closing and opening times of 0.5 s, 0.1 s and 0.05 s were simulated, giving net unbalanced forces on the header of 10 kN, 36 kN and 62 kN respectively. For 0.05 s, the 62 kN is the sum of 50 kN on the trip line and 12 kN on the 24 inch line, which are on opposite sides of the header. These forces act in the eastern direction, as did the observed movement. A force of 62 kN corresponds to about 30 mm of displacement, too small to explain the observed displacement. The reported actual times are 300 ms for closure and 2000 ms for opening, so the actual forces are most probably lower.
Information from on-site engineers indicated another possible mechanism. The trip line is operated only during a turbine trip and contains steam traps. When idle it is at 227°C, below the 232°C boiling temperature at line pressure. If the steam traps malfunction, condensate may collect in the lower sections of the line and would be propelled through it as a single slug when the line is operated. The liquid in this mechanism is water that built up in the line during normal operation; none is formed from steam during the trip.
Frequently Asked Questions
Why did a branch break off an MP steam header when a compressor turbine tripped?
A static analysis gave a lateral displacement of 13 mm against about 180 mm observed, so elevated pressure and temperature did not explain the movement. Surge forces of up to 62 kN account for about 30 mm. A single slug of condensate collected in the idle trip line was considered the most plausible mechanism, although the steam trap malfunction behind it could not be confirmed in the field.
Can quench water form a slug when HP steam is let down to an MP header?
No. The energy balance showed that the throttled HP steam evaporates all 50 tonnes/hr of quench water, on the assumption that energy transfer is complete within the at least 20 m of pipeline before the header. With no evaporation at all, three flow regime maps predicted annular or wavy flow, which are steady and do not generate large piping loads.
How many slug impacts does the fatigue assessment allow at the highest-stressed header tee?
About 2,500 with the additional guides and axial restraints, and about 1,000 with the additional guides only. At node 2040 the stress of 150 MPa is doubled to a stress amplitude of 300 MPa, for which the design fatigue curve allows about 10,000 cycles. Four full stress cycles are taken per slug impact as a conservative value.