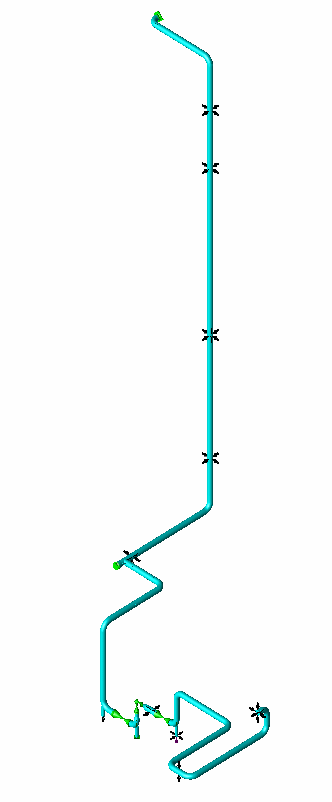
A wash oil line was vibrating in the vertical section downstream of its angle control valve. It has been reported that the vibration amplitude increases with increasing flow, and in the future the mass flow rate may still be increased further.
No vibration measurements had been carried out, so the amplitude, the frequency and the relative displacements were not measured, and the available data were based on visual observation and on estimates of the vibration frequency. A pipe stress model was used to investigate possible causes of the vibrations, to assess the dynamic stresses and to propose mitigation measures.
Excitation mechanism and baseline results
Across the control valve the pressure drops from 150 bar to 9 bar while the temperature stays at about 40 °C, and downstream of the valve 2 per cent of the total mass flow is vapour and gas. The two-phase character of the flow downstream of the valve introduces unsteady phenomena, these unsteady conditions result in slug formation, and the unbalanced loads from the slugs excite the natural modes of the piping. Slug flow is broad band rather than fixed in frequency, so the piping responds in its own modes, and a low frequency mode may lock in with the slug formation.
The Taitel and Dukler criteria and the Baker et al. criteria both indicate that a slug flow condition is probable, and slug flow is therefore a very likely excitation mechanism. The slug load was quantified at 2031 N and applied simultaneously at the bends of the line in a spectrum analysis. The load rises with the square of the mass flow, so doubling the flow quadruples the load, and the displacements and stresses increase accordingly. This may explain the observed increase in vibration level when the flow is increased, and it bears on any further increase in mass flow rate.
The existing pipe stress model, prepared in CAESAR II from the line isometrics and the supplied flow data, was used as the starting point. The line is insulated and is made from Carbon Steel A-106 Gr.B, and the pipe stress was evaluated in accordance with ASME B31.3.
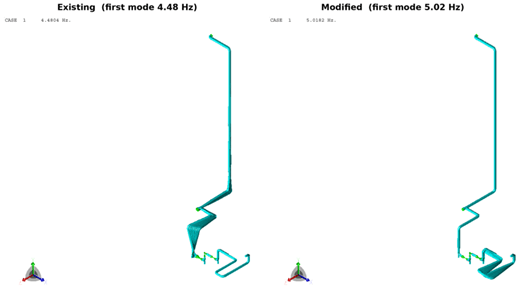
In the existing arrangement the predicted maximum dynamic displacement is 7.6 mm, driven mainly by the first natural mode at 4.48 Hz, and the maximum dynamic stress component downstream of the valve is 23 MPa at a Tee connection. In the hot design case the sustained stress is 41.6 per cent of the allowable primary stress and the expansion stress is 83.6 per cent of the allowable secondary range, in both cases at the reducer immediately upstream of the control valve. These are predicted values that may differ from reality.
Support modifications and their effect
Rerouting the line, changing the pipe diameter and relocating the valve were not realistic options, so the work was focused on the support system.
Two measures were implemented in the model. At one location a guide and an axial stop were introduced, and a restraint in the Z direction was added at the baseplate of the dummy support. No change to the process layout is involved.

The predicted maximum dynamic displacement falls from 7.6 mm to 0.36 mm, and the maximum dynamic stress component from 23 MPa at the Tee connection to 5.7 MPa at the reducer immediately upstream of the control valve. In the hot design case the static stress levels remain about the same as in the existing condition, the sustained and expansion stresses moving from 41.6 and 83.6 per cent of their allowables to 42.2 and 83.4 per cent.
Fatigue assessment
At the predicted stress amplitude of 23 MPa, assessed in accordance with Appendix 5 of Section VIII Division 2 of the ASME Boiler and Pressure Vessel Code, the allowable number of alternating cycles is larger than 1010, while continuous vibration at 6 Hz builds up 2 × 10⁸ cycles in a year, so the predicted level could be allowed for a period of at least 50 years. The picture changes quickly with amplitude. If the real amplitude were twice the predicted value the stress amplitude would also double, to 46 MPa, and the allowable number of full cycles would be much lower, 600 000. The fatigue curve includes a safety factor of 2 on stress and/or 15 on cycles, and taking this into account a fatigue problem could become visible during operation at that vibration level.
The excitation amplitude is the one quantity that was estimated rather than measured, which is why vibration measurements are needed before firm conclusions on fatigue are drawn.
Conclusions
On the predicted amplitudes a fatigue problem seems very unlikely. Double those amplitudes and the allowable cycle count falls to 600 000, so the verdict rests on measurement, not on the model alone.
- Support function is the practical lever when the layout is fixed. Without rerouting, resizing or moving the valve, two support measures took the predicted movement from millimetres to a fraction of a millimetre and the predicted dynamic stress from 23 MPa to 5.7 MPa, while the static stresses stayed about the same.
- The slug load rises with the square of the mass flow. Doubling the mass flow quadruples the load, and the displacements and stresses increase accordingly, so the effect of any further increase in mass flow rate can be estimated on the same basis.
- Measurement turns a plausible answer into a firm one. The model indicates that fatigue is very unlikely, but it rests on an estimated excitation mechanism. Vibration measurements would allow the model to be tuned, after which the fatigue verdict can be stated with confidence.
The predicted vibration levels and the assumed excitation mechanism match the observed behaviour well, noting that the comparison rests on visual observation because no measurements are available. Whether the true excitation proves larger or smaller than assumed, the benefit of the proposed measures is proportional, so a considerable improvement in vibration level may be expected when they are implemented in the field.