
Extending an LNG terminal with a new cryogenic bunkering line
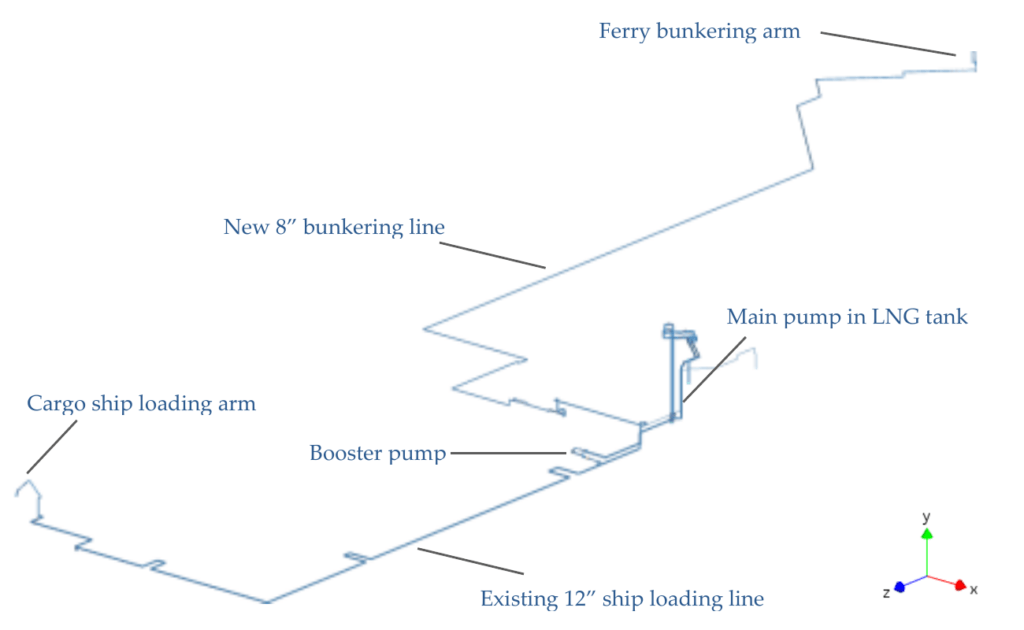
At an LNG storage and loading terminal, a new line was constructed to supply liquefied natural gas directly to ferries. This 8-inch bunkering line branches from an existing 12-inch line that is used to load LNG into cargo ships. A booster pump raises the pressure of the LNG and delivers it through a loading arm that connects to the ferry’s onboard piping. Because the two lines share the same in-tank main pump and the same source of LNG, they form a single hydraulically connected system rather than two independent pipelines.
LNG is handled at roughly −161 °C, close to its atmospheric boiling point. The new 8-inch line between the skids uses PN16 vacuum-insulated pipe, with a design pressure of 16.0 barg and a maximum allowable pressure of 17.6 barg. The existing 12-inch line is built to ASME B31.3. During operation, any sudden change, such as a pump trip or a fast valve closure, sends a pressure wave through the liquid. These transient events, known as surge or water hammer, can briefly raise pressures above steady-state values and generate unbalanced forces on the piping and its supports. Following an independent technical review of the upset conditions for each line, a surge study of the combined system was carried out before the new line entered service.
Building a transient model of two hydraulically coupled lines
The analysis was carried out in BOSfluids 5.1, a transient flow solver that models the piping as a one-dimensional, single-phase system and tracks how pressure waves travel through it at finite speed. The full geometry of both lines, including the minimum-flow return lines, was built from the project isometrics so that the model reflected the actual routing, including the long straight runs through the culvert and the pipe rack.
The LNG was modelled at −161 °C, with a density of 452 kg/m³ and a bulk modulus of 962 MPa. The bulk modulus, together with the elasticity of the pipe wall, governs how fast pressure waves travel, and with it the size of the surge produced by a given change in flow. The LNG is slightly warmer near the loading arm (about −158 °C) than at the bottom of the tank. A check on the governing pressure case showed that the warmer, less dense fluid gives a slightly lower maximum surge pressure, so the colder, denser condition was used throughout.
All components that shape the pressure and flow distribution were included. The in-tank main pump and the booster pump were modelled from their pump curves and their rotational inertia: 16 kg·m² for the main pump and 3.66 kg·m² for the booster pump. Inertia matters because after a trip the spinning mass keeps the pump turning briefly; the larger the inertia, the slower the pressure falls and the smaller the resulting unbalanced forces. The fiscal metering skid, a set of 4-inch Coriolis flow meters with several elbows, was represented as an orifice tuned to reproduce its pressure loss. The control and emergency shutdown (ESD) valves were entered with their flow coefficients and stroke times, ranging from 9 seconds for the bunkering ESD valves to 14 seconds for the ship-loading ESD valve. Any damping effect of the gas volume in the booster pump sump was neglected, as it was judged to be negligible during operation.
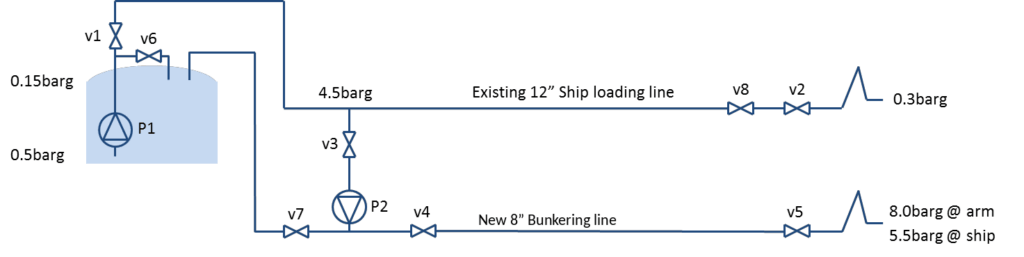
Table 1 · Pumps and valves in the flow model
| Ref. | Description |
|---|---|
| P1 | Main pump (in-tank) |
| P2 | Booster pump |
| v1 | Main pump control valve |
| v2 | Ship-loading ESD valve |
| v3 | Bunkering inlet ESD valve |
| v4 | Bunkering flow control valve |
| v5 | Bunkering outlet ESD valve |
| v6 | Main pump minimum-flow valve |
| v7 | Booster pump minimum-flow valve |
| v8 | Ship-loading control valve |
Defining operating modes and upset scenarios
Because a transient always starts from a particular operating condition, four steady-state modes were established first. Each mode fixes the pump speeds, valve positions and pressures that define the starting point of a simulation.
The four modes were ship loading only, at 1100 m³/h through the 12-inch line; bunkering only, at 450 m³/h through the 8-inch line; simultaneous operation, with 650 m³/h ship loading and 450 m³/h bunkering for a total of 1100 m³/h through the main pump; and a minimum-flow mode, in which the booster pump recirculates 200 m³/h back to the tank while the main pump delivers 400 m³/h.
From these baselines, nine transient upset scenarios were defined together with the client, building on the earlier technical review:
- IFull functional ESD of both lines
- IIFull ESD, with the main pump failing to stop
- IIIFull ESD, with the booster pump failing to stop
- IVMain pump trip
- VBooster pump trip
- VIUnexpected closure of the bunkering inlet ESD valve
- VIIUnexpected closure of the bunkering outlet ESD valve
- VIIIUnexpected closure of the ship-loading ESD valve
- IXUnexpected closure of the booster pump minimum-flow valve
Each scenario was simulated from every operating mode in which it could occur, with the system held at steady state for one second before the transient was triggered. Combinations involving simultaneous failures of unrelated components were excluded from scope by agreement with the client.
Pressure results
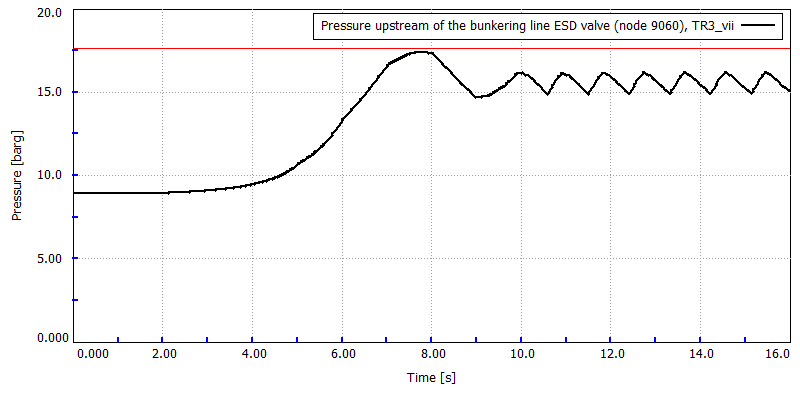
The peak pressures in both lines stayed within their allowable limits in every case analysed. The tightest margin occurred in the 8-inch line during an unexpected closure of the bunkering outlet ESD valve, starting from simultaneous operation. As flow through the main pump fell, the pump moved back along its curve and delivered a higher discharge pressure; the surge from the closing valve added to this rise. The pressure upstream of the valve peaked at 17.4 barg, above the 16.0 barg design pressure but below the 17.6 barg maximum allowable pressure.
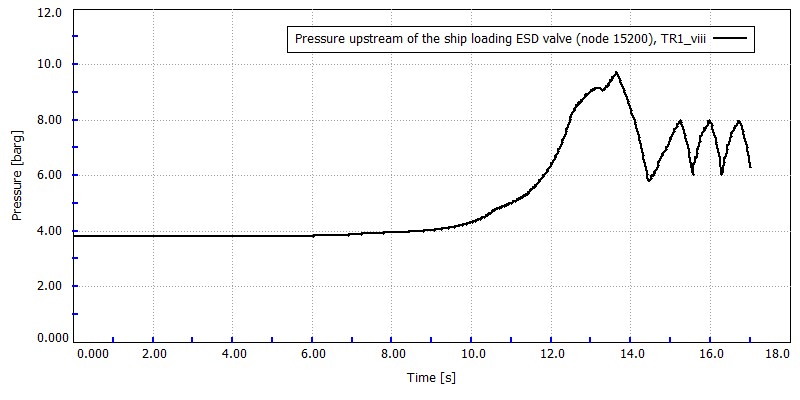
In the 12-inch line, the peak pressure was 9.7 barg, reached when the ship-loading ESD valve closed against the full 1100 m³/h flow with the main pump still running. This is below the allowable pressure of that line.
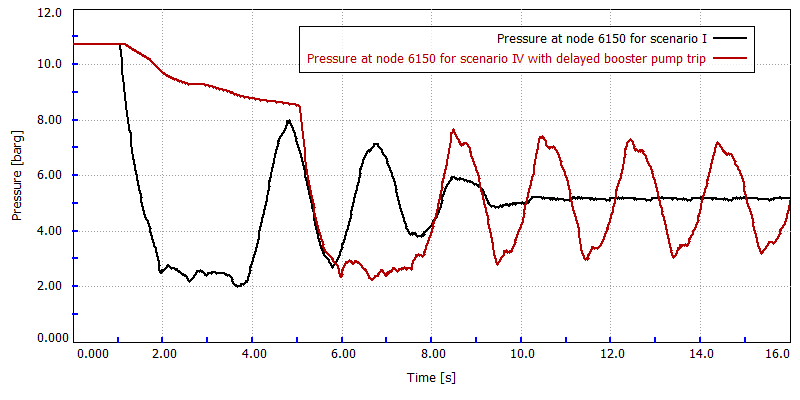
Minimum pressures were also checked. When the booster pump trips, the pressure in the 8-inch line falls to its minimum within about one second, but at the highest point of the pipe rack it remained above 2 barg, well above the vapour pressure of the LNG (about 0 barg). No vapour formation was therefore expected, which is consistent with the single-phase modelling approach.
Unbalanced force results
With pressures within limits, attention turned to unbalanced forces. Because pressure waves travel at finite speed, the pressures at two consecutive elbows briefly differ as a wave passes between them. The resulting imbalance is not offset by friction along the pipe wall, leaving a net axial force on that pipe section. These forces increase with the rate of pressure change and with the distance between consecutive elbows.
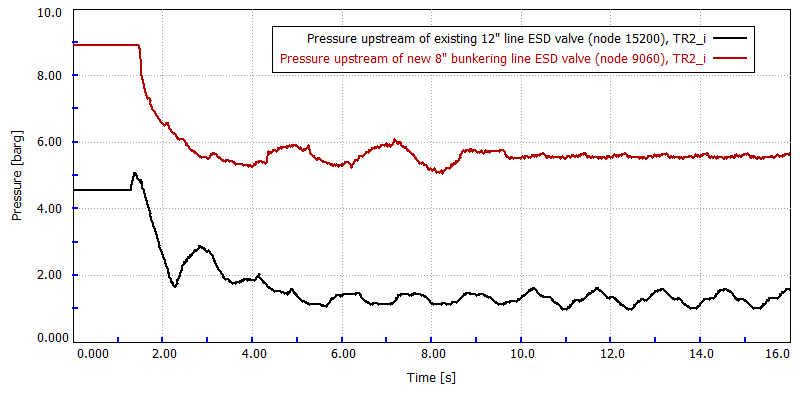
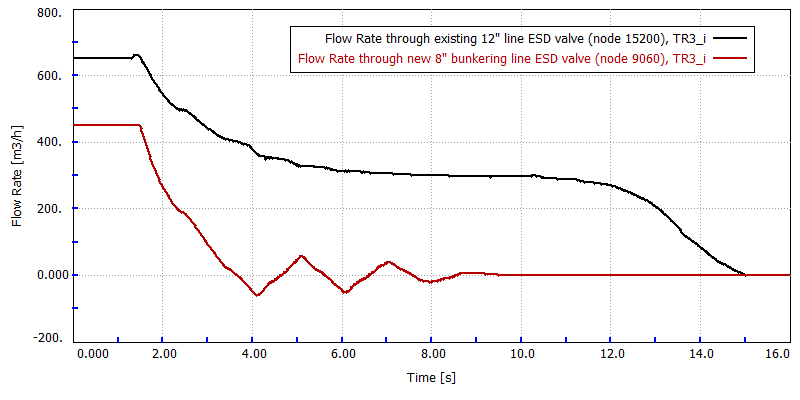
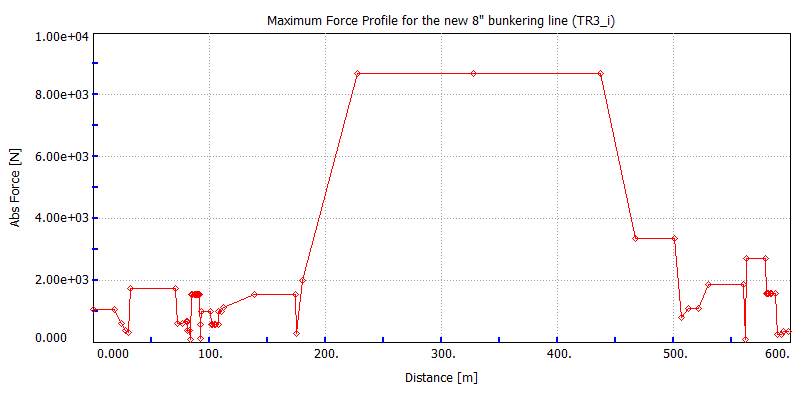
In the 8-inch line, the largest forces came from scenarios involving a booster pump trip, which produces the fastest pressure drop because of the pump’s relatively low inertia. The governing case was the full ESD starting from simultaneous operation: the pressure and flow in the bunkering line dropped rapidly, while the 12-inch line briefly saw a rise in pressure and flow before both lines came to rest. The highest force was 8.7 kN, on the 209-metre straight run through the culvert.
In the 12-inch line, the governing mechanism was different. The largest force, 8.1 kN, occurred on the 107-metre section in the pipe rack when the ship-loading ESD valve closed against the full 1100 m³/h flow with the main pump still running. No pump trip is involved in this case.
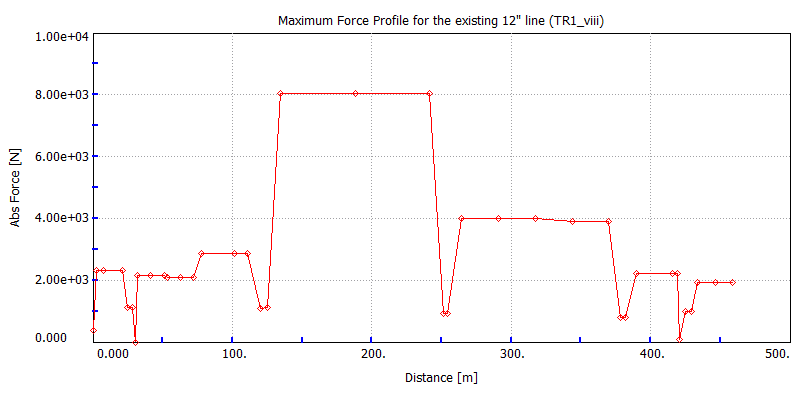
Time-history files of the unbalanced forces for both governing cases were delivered alongside the results.
What the analysis reveals about surge in coupled LNG systems
The study shows that when a new branch is connected to an existing line, the two behave as one system. When flow on the bunkering line was cut off, by a valve closure or a booster pump trip, flow in the ship-loading line rose by roughly 11 to 15 percent as the shared main pump redistributed its output. Analysing each line in isolation would miss this interaction.
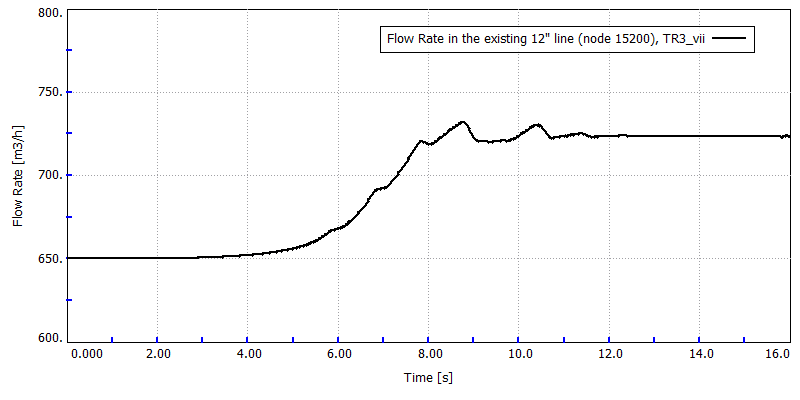
The results also show the importance of pump inertia and pipe geometry. The booster pump’s relatively low inertia made its trip the governing load case for the bunkering line, while the long straight runs in the culvert and pipe rack were the locations of the highest forces in both lines. These are the areas to focus on when assessing pipe supports in similar cryogenic layouts.