
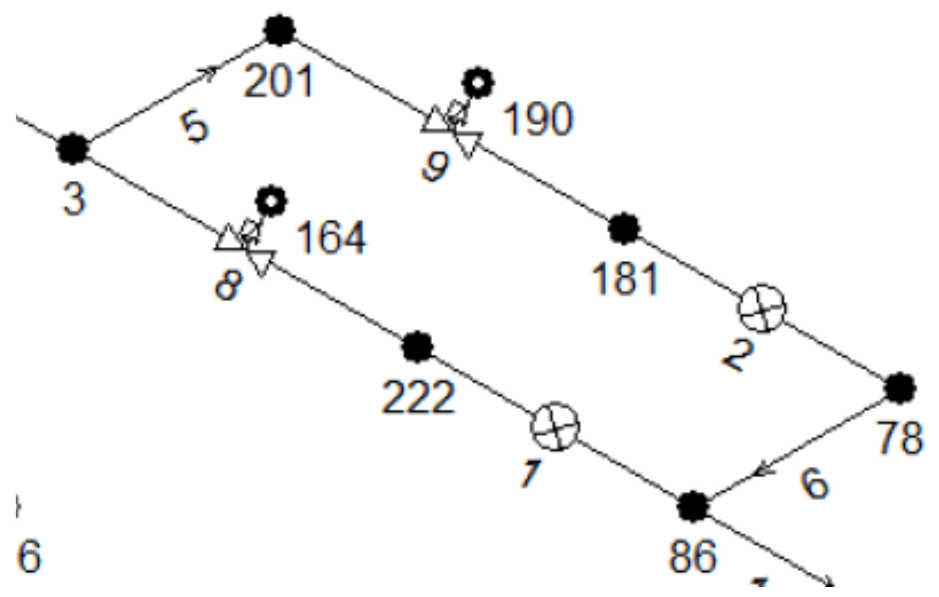
An underground storage station was being expanded with an additional compressor and a third injection well cluster, and the existing firewater package was being extended as part of the project. Two jockey pumps pressurise the system. When a blowout alarm is raised, the deluge valves open and the main firewater pumps start. The pumps supply a deluge manifold package, which supplies each cluster through initially dry firewater lines, with GRE used for the underground part. At each cluster the flow splits into branches and passes to twelve spray nozzles. The sprayed water is collected in a drain system and returned to the deluge system through a recycle unit with recycle pumps. The nozzles have a minimum operating pressure of 3.5 barg and a maximum operating pressure of 5 barg. The system supplier carried out hydraulic, surge and water hammer analyses in Pipenet to verify the maximum and minimum pressures during the transient scenarios and to determine the unbalanced loads. The results raised concerns at the client, and a third-party review was requested.
Review Scope Without the Original Pipenet Model
The Pipenet model was not made available to the reviewer. The review worked from the supplier’s hydraulic and water hammer reports and their appendices, and reconstructed the modelling approach from them. Large-scale shadow calculations were not included; only local verification calculations were made, and the supplier’s reported results were assumed to be valid. The inputs checked were fluid properties, fittings, spray nozzles, orifices, flow method, pipe diameters and lengths, pump curves, boundary conditions and elevation difference. For the water hammer report the check also covered non-return valves, wave speed and pressure control valves.
Hydraulic and Water Hammer Model Input Checks
Fluid properties and spray nozzle modelling were correct in both reports. In the hydraulic report, manual calculations showed a correct modelling of the orifice plates, and the Hazen-Williams friction method gave small differences in pressure loss compared with a Darcy friction method. The water hammer report models the orifice plates as general pressure loss components with a zero resistance coefficient, which the review concluded is incorrect. The wave speeds in the water hammer report, 666 m/s for GRE and 1335 m/s for steel, are within the range of typical values. The line from the deluge skid to one cluster has no fittings in either model and is missing eight elbows. In the hydraulic report their equivalent length is about 60 m, giving an additional pressure loss of around 0.08 barg, and the review did not expect the omission to influence the steady state or transient results significantly. The flow scheme shows a reducing diameter from the underground GRE towards the spray nozzle, which neither model includes. The water hammer model includes nine non-return valves, four of them downstream of the deluge valves, where the flow scheme shows none.
The pump curves were approximated with a quadratic function. The main firewater pump curve compares well with the actual curve. The recycle pump curve is a fairly poor approximation away from the rated point: in the hydraulic analysis the pump operates close to the rated point and was modelled with sufficient accuracy, while in the water hammer analysis the approximation can cause an overestimation of pressure during start-up. The jockey pump curve in the water hammer analysis is a very poor approximation, which will significantly affect the initial pressure at the deluge valve.
The general arrangement drawing of the pump skid gives a main pump inlet pressure between 0.1 barg (minimum water level) and 0.5 barg (top of basin). The hydraulic model used -0.2 barg and the water hammer model used 0 barg. The elevation difference modelled upstream and downstream of the pumps could not be verified; on that basis the modelled pressure may be underestimated by more than 0.5 barg. A lower inlet pressure may or may not give a conservative scenario, and may result in cavitation during transients. The spray nozzles were back-calculated to be around 1 m above grade level, where the true elevation is around 1.7 m.
Item | Value in the analysis | Reference value |
Main pump inlet pressure | -0.2 barg (hydraulic model); 0 barg (water hammer model) | 0.1 to 0.5 barg (pump skid drawing) |
Spray nozzle elevation above grade | About 1 m (back-calculated) | About 1.7 m |
Flow through 54-PCV-005C to the spill-over | 2937 L/hr (scenario 1.1, hydraulic analysis) | 2000 L/hr maximum capacity (water hammer report) |
Table 1. Values used in the analysis compared with reference values stated in the review.
The hydraulic report contains no input or description for the pressure control valves (PCVs). The review assumed that 54-PCV-005C was modelled as a pressure relief valve at 6.5 barg. The water hammer report gives this valve a maximum flow capacity of 2000 L/hr, while the steady state flow through it to the spill-over in scenario 1.1 of the hydraulic analysis is 2937 L/hr, so a pressure relief valve is an incorrect way to model it. In reality the pressure at the valve will be higher, which changes the pump operating point and the total flow to the nozzles. For the water hammer model the review assumed that 54-PCV-005C was simulated with two operating valves in series, one of which is closed at any moment, so no flow goes to the spill-over. For 54-PCV-005 A/B the review assumed a combination of operating and regulator valves; if that is the method used, the regulator set pressures and the sizing coefficients are incorrect. No sizing data is given for 56-PCV-004.
Nozzle Pressure Margin, Spill-Over Flow and Fire Scenarios
The system was designed around the minimum nozzle operating pressure of 3.5 barg. The review considered this a poor design approach, because deviations of the actual system from the model could lower the nozzle inlet pressure below the minimum, and a pressure drop of 0.03 barg at cluster 3 would be enough. It gave three reasons for expecting the pressure to fall below the minimum: the nozzle elevation, the boundary conditions upstream of the main firewater pump and the modelling of the pressure control valve. It suggested designing for a nozzle inlet pressure closer to the maximum operating pressure of 5 barg.
More than 50% of the flow through the main pump does not reach the spray nozzles. The hydraulic report gives no context for this; the review found that the flow leaves the system through a spill-over regulated by a pressure control valve, and the spill-over routing and pipe properties were not available to the review. The review questioned the use of pressure control valves in the firewater system and considered them incorrectly designed, which could render all clusters inoperative in several fire scenarios.
Only fire scenarios with a single cluster demanding firewater were checked; scenarios with two or more clusters were not. The hydraulic analysis modelled the main pump as turned off while the recycle pump ran, although the water hammer report has the main pump continuing to run. The jockey pumps were not included in the hydraulic analysis, which the review considered acceptable because they will most likely discharge all their flow through the spill-over. The water hammer analysis runs one main pump and one recycle pump; the flow schemes do not make clear whether both start in a fire, and if they do, higher slug loads and pressure surges can be expected. The model starts the pumps about 11 s after the deluge valve opens and takes 4 s to start them up, and a faster start-up creates higher pressure loads. The review was not convinced that the firewater system as designed will meet the requirements.
Initially Wet Pipes in the Start-Up Surge Analysis
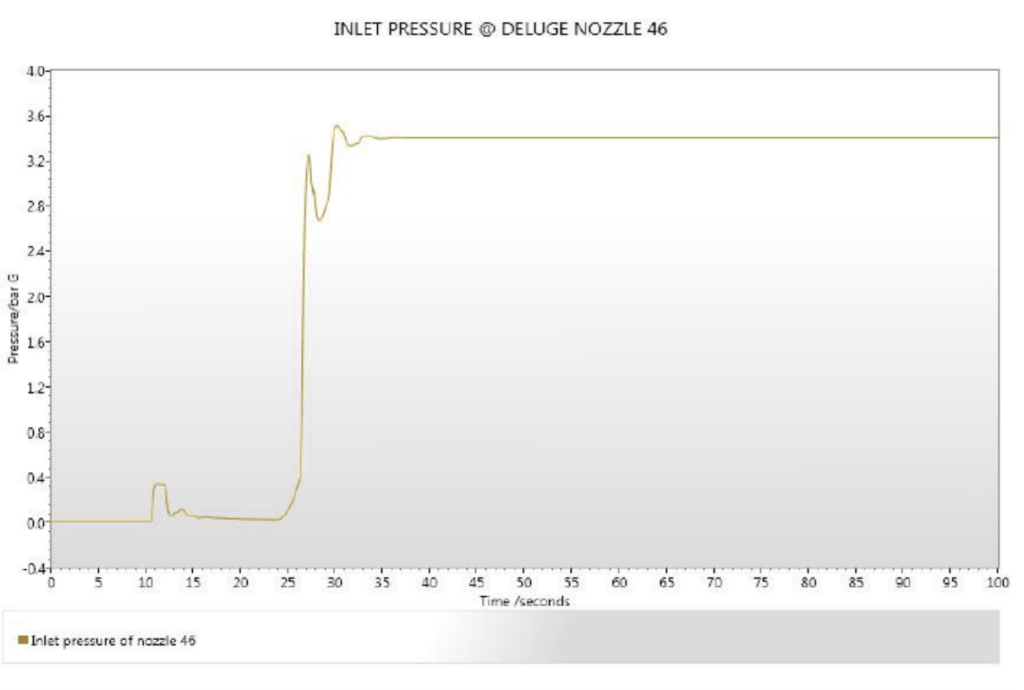
In the water hammer analysis, the pressure trace for a nozzle in cluster 3, about 500 m from the deluge valves, shows the deluge valve opening at 10 s and a pressure increase at the nozzle at 11 s. The review stated that this can only be observed with the wave speed of water; the wave speed of air is about 330 m/s. The pump starts at 21 s and runs at full speed at 25 s, and the nozzle is fully operational at 30 s. The review stated that this is impossible with dry pipes, because the pumps would need to deliver an average flow of 10602 L/min to fill the pipe up to the nozzle, while the maximum pump capacity is around 2000 L/min. It concluded that the pipes downstream of the deluge valves were modelled as initially wet and called this a major modelling error. The review stated that the wet pipes create a buffer effect, so that the surge pressures and unbalanced loads are underestimated and the time for the system to become operational is underestimated by possibly minutes.
Cavity Separation, Unbalanced Forces and ASME B31.3 Omissions
The water hammer report states that cavity separation can occur during start-up of the firewater pumps. The flow method does not include cavity separation calculations. No calculation of unbalanced forces was found, although large unbalanced forces can occur during start-up and should be evaluated against allowable support loads. The maximum pressure was evaluated using ASME B31.3-2002, which is not applicable to GRE pipelines.
Dry-Pipe Re-Analysis and Information Required
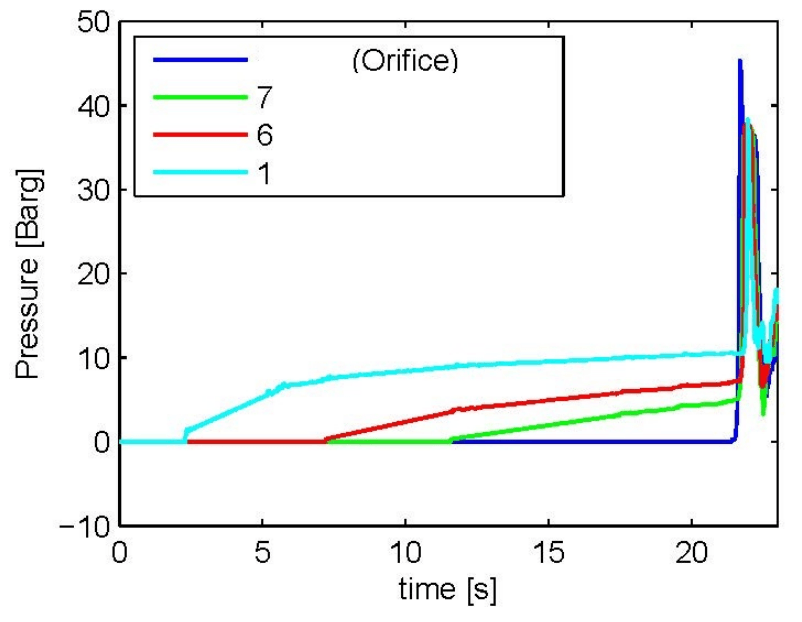
To estimate the maximum water hammer effects at start-up properly, the analysis has to be repeated with initially dry pipes. The review stated that the pressure spikes in an initially dry system are more sudden and higher, and cited a separate analysis by the reviewer of a different firewater system, in which the spikes are larger and shorter than in the supplier’s nozzle trace. It also stated that the wet-pipe simplification may result in substantial underestimation of the water hammer pressure effects. Quantifying the effects of the modelling unclarities and possible mistakes requires a more detailed analysis and more information on geometrical details and pipe properties. A detailed analysis can take a redesign of the pipe diameters into account, which will most likely reduce the time to prime the system, and can reconsider the location and sizing of the orifice plates, which may remove the need for them.
Questions on Deluge Firewater Water Hammer Analysis
Why does a deluge system with initially dry pipes need a dry-pipe water hammer model?
The review stated that modelling the pipes downstream of the deluge valves as initially wet creates a buffer effect. Surge pressures and unbalanced loads are then underestimated, and the time for the system to become operational is underestimated by possibly minutes. To estimate the maximum water hammer effects at start-up properly, the analysis has to be repeated with initially dry pipes.
How can a pressure trace show that deluge pipes were modelled wet?
In the supplier’s water hammer analysis, a nozzle about 500 m from the deluge valves shows a pressure increase at 11 s, one second after the deluge valve opens at 10 s. The review stated that this can only be observed with the wave speed of water, since the wave speed of air is about 330 m/s. The pump runs at full speed at 25 s and the nozzle is fully operational at 30 s, which the review stated is impossible with dry pipes.
Is ASME B31.3 applicable to the maximum pressure evaluation of GRE pipelines?
No. The supplier evaluated the maximum pressure in the system using ASME B31.3-2002, and the review stated that this code is not applicable to GRE pipelines.