Effective mixing in bioreactors is essential for maximizing mass transfer, homogenizing chemical species, and ensuring uniform biological activity. The client undertook a computational fluid dynamics study in collaboration with Dynaflow Research Group to evaluate the performance of a 60 m³ hydrogen sulfide (H₂S) bioreactor, with a specific focus on mixing efficiency, hydrodynamics, and the behavior of injected H₂S under defined operational parameters. This case study presents a technical overview of the methodology, key findings, and implications for reactor design and operation with a focus on applied CFD for bioprocess optimization.
Analysis Setup and Model Description
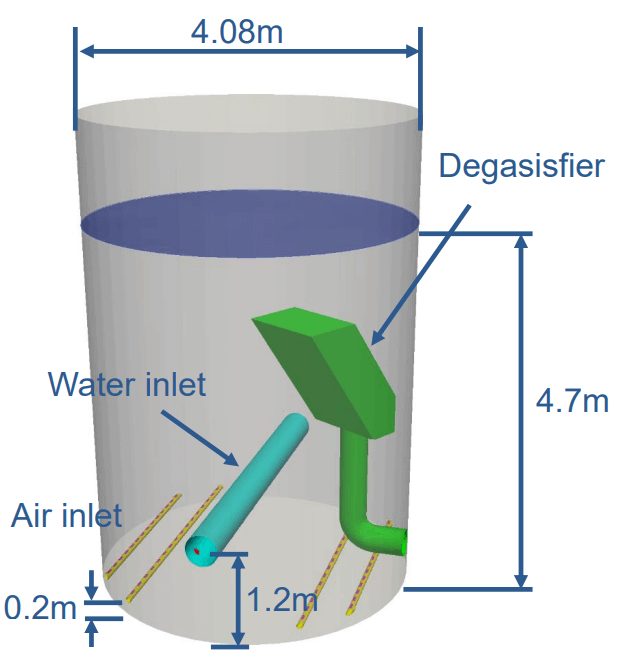
The bioreactor under study has an internal liquid volume of 60 m³, with a working water level at approximately 4.7 meters, about 1 meter above the degasifier. The reactor is equipped with a series of inlets: one main water inlet pipe (Ø400 mm) that feeds through 20 downward-facing holes (Ø85 mm), and four air inlet pipes (Ø75 mm each) supplying air via 60 holes (Ø10 mm each), distributed between inner and outer tubes. These inlets are designed to promote strong mixing by introducing fluids at an angle and spacing that enhance turbulent interaction.
Operational parameters were set to reflect typical process conditions, with the water flow rate at 500 m³/h and air at 705 Nm³/h. The water’s density and viscosity were defined as 1050 kg/m³ and 1 cP respectively, while air was modeled with compressibility effects (density set as p/(RT)). The initial air bubble size was assumed to be 5 mm, and an isothermal bubble diameter model was applied. No thermal effects were included, and the diffusion coefficient for H₂S in water was taken as 1.36·10⁻⁹ m²/s.
Numerical Approach
The CFD analysis was conducted using OpenFOAM’s two-phase EulerFoam solver, which computes separate velocity fields for air and water using an Eulerian approach. The solver accounts for momentum exchange via an air fraction parameter, enabling accurate simulation of interphase dynamics and compressibility effects due to rising bubbles. To allow for detailed tracking of H₂S mixing, the solver was extended to include a passive scalar equation that includes both advection and diffusion, solving for the dissolved H₂S concentration using water velocity as the advective velocity.
Hydrodynamics and Mixing Performance
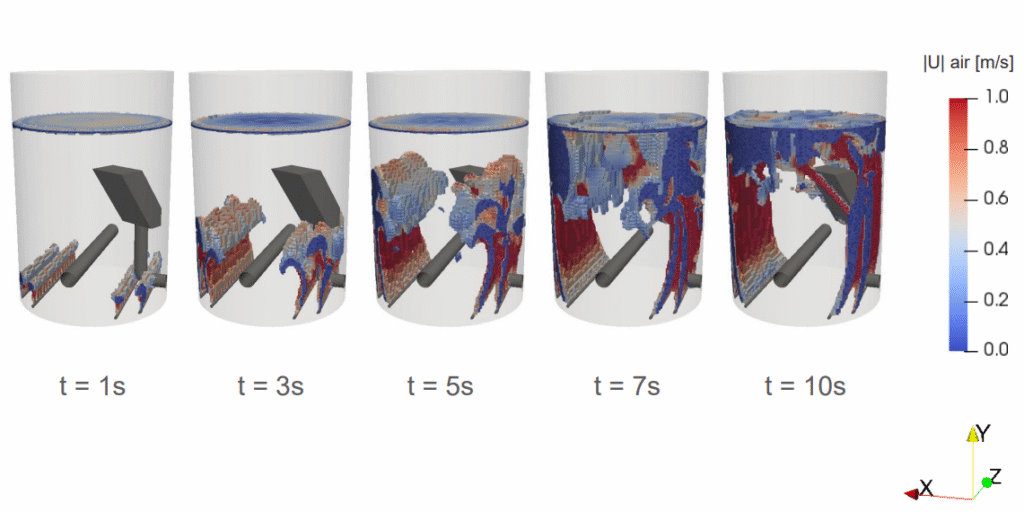
The simulation results provide a clear picture of the temporal evolution of mixing and flow structures within the bioreactor. Upon startup, the air bubble column rises rapidly, reaching the liquid surface within 7 seconds. The water flow interacts with the air, pushing the bubble columns toward the tank walls and establishing recirculation zones. After 40 seconds, the flow regime stabilizes, exhibiting a fully developed circulation pattern: water is driven downward beneath the air tubes and rises adjacent to the tank walls.
H₂S Mixing Efficiency
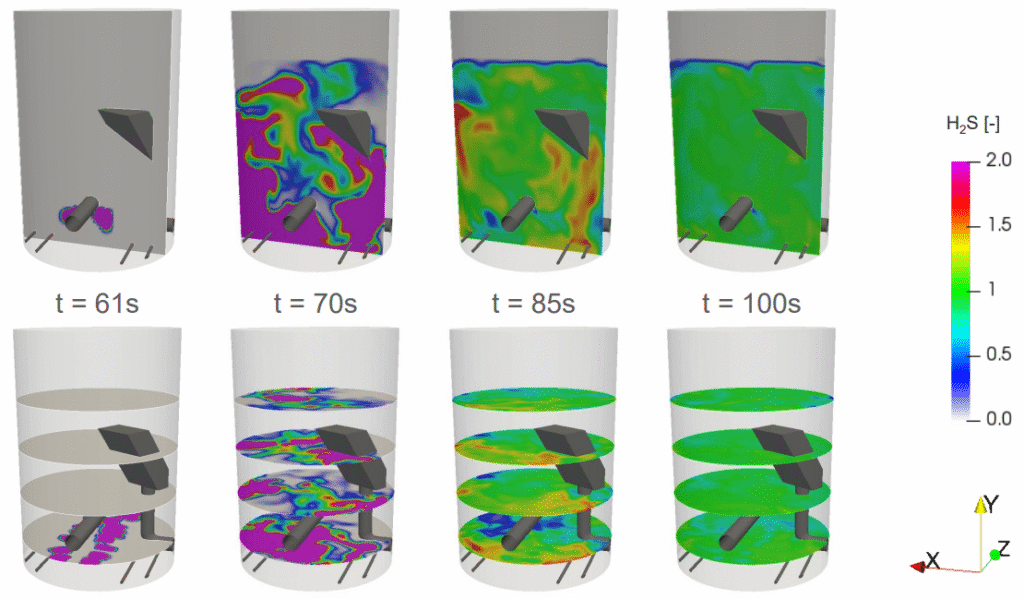
A critical part of the study was quantifying mixing efficiency using an H₂S pulse test. At 60 seconds (when flow is fully developed) a 1-second pulse of highly concentrated H₂S was injected at the water inlet. This scenario simulated a step change in inlet concentration, providing a direct assessment of how quickly the reactor homogenizes a tracer.
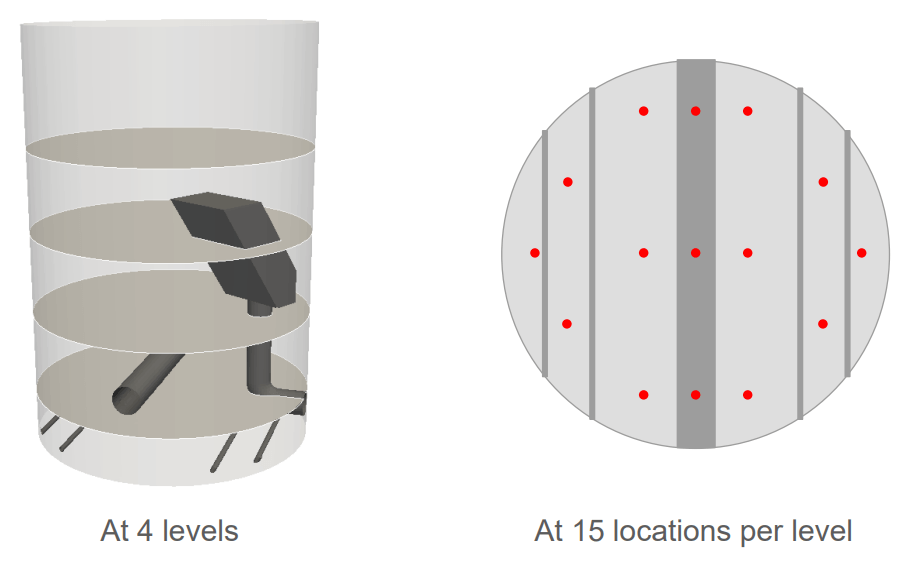
The total H₂S injected (0.14 m³) corresponds to a target homogeneous concentration of 0.0023 m³ H₂S per m³ water, if perfectly mixed. To monitor the mixing process, H₂S concentrations were monitored at 60 discrete locations, distributed across four vertical levels and 15 positions per level. Analysis focused on both the average concentration (reflecting global mixing) and the standard deviation (reflecting spatial uniformity).
Results demonstrated rapid mixing: within 40 seconds after injection (t = 100 s), the standard deviation of H₂S concentration across all monitoring points dropped to near zero, and the average concentration matched the theoretical homogeneous value. Visualizations confirm that H₂S disperses swiftly throughout the reactor, with no significant persistent concentration gradients.
Conclusions and Engineering Implications
The CFD analysis yielded several conclusions. First, air mixing time is rapid, with bubble columns reaching the surface in under 10 seconds. Fully developed flow is reached after 40 seconds. Most importantly, the reactor demonstrates excellent mixing efficiency for dissolved H₂S: a pulse of concentrated H₂S is fully homogenized within 40 seconds, as evidenced by the convergence of monitored concentrations and vanishing standard deviation.
These findings validate the reactor’s design for fast and uniform mixing, essential for biological and chemical process control. However, the study also highlights areas for further investigation, including the identification of potential dead zones with low velocity, the influence of asymmetric degasifier placement on flow uniformity, and the quantification of air entrainment into the degasifier.